Integrating TS Chart Configurator
With the TS Chart SDK, you can customize your configurator. This is mainly done by using the chartConfigEditorDefinition function. This function is a prop to getChartContext and primarily takes two parameters: chartModel (from which we extract the config) and customChartContext. This can also be a static object of type ChartConfigEditorDefinition[].
Validation
You can also run some validations on the chartConfig that you will be receiving from TS using the validateConfig function. For example, suppose a chart does not support more than two columns; you can put that code in this function to run validation. This function is also part of getChartContext and receives updated chartConfig and chartModel as parameters.
Chart Config Editor Definition
The chartConfigEditorDefinition has properties such as key, label, and text, but the important section here is chartConfigSection. Based on the flags given in this section, your configurator will be defined.
Key Properties
- maxColumnCount: For each section, the maximum number of columns that are allowed.
- allowMeasureColumns: Are measure columns allowed in this section?
- allowAttributeColumns: Are attribute columns allowed in this section?
- allowTimeSeriesColumns: Are time series (date) columns allowed in this section?
- allowMeasureNameColumn: Is the measure name column allowed in this section?
- allowMeasureValueColumn: Is the measure value column allowed in this section?
Example
Let's take a look at an example of chartConfigEditorDefinition.
(async () => {
  const ctx = await getChartContext({
    // other props
    chartConfigEditorDefinition: (
      currentChartConfig: ChartModel,
      ctx: CustomChartContext
    ): ChartConfigEditorDefinition[] => {
      const { config, visualProps } = currentChartConfig; // config of type ChartConfig[] contains the columns id, types, and other properties.

      const yColumns = config?.chartConfig?.[0]?.dimensions.find(
        (dimension) => dimension.key === "y" && dimension.columns
      ); // here 'y' refers to the measure value column.

      const configDefinition = [
        {
          key: "column",
          label: "Custom Column",
          descriptionText:
            "X Axis can only have attributes, Y Axis can only have measures, Color can only have attributes. " +
            "Should have just 1 column in Y axis with colors columns.",
          columnSections: [
            {
              key: "x",
              label: "Custom X Axis",
              allowAttributeColumns: true,
              allowMeasureColumns: false,
              allowTimeSeriesColumns: true,
              maxColumnCount: 1,
            },
            {
              key: "y",
              label: "Custom Y Axis",
              allowAttributeColumns: false,
              allowMeasureColumns: true,
              allowTimeSeriesColumns: false,
            },
          ],
        },
      ];
      if (yColumns?.columns.length) {
        // If yColumns are present, add the same number of layers as columns.
        for (let i = 0; i < yColumns.columns.length; i++) {
          configDefinition[0].columnSections.push({
            key: `layers${i}`,
            label: `Measures layer${i}`,
            allowAttributeColumns: false,
            allowMeasureColumns: true,
            allowTimeSeriesColumns: false,
          });
        }
      }
      return configDefinition;
    },
  });
})();
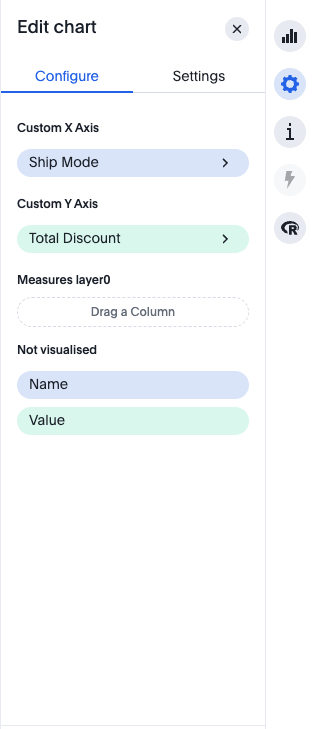
There is final result for configurator for this example.